Bond Volatility Is Not Yelling "Fire"
- Chris Kline

- May 15
- 2 min read
1.) RATES – Yields are up across the curve… again… this morning. What does that mean? It simply means the bond market sees inflation the way we do… accelerating. But there isn’t a “revolt” in the bond market yet, with bond volatility fairly muted. The MOVE Index – bond volatility – is sitting at 69.63, down from 77.86 on May 4th. That was a lower high, and we’ve seen another lower high put in just the other day on May 12th. So, until bond volatility breaks out, the bond market likely remains weak but calm as rates rise. Do rates become a problem at some point? Probably. But that time is not yet. Remember, the bond market has really been range-bound for 2 years, the MOVE Index is not stressed, and the weakness has been orderly and measured. The MOVE Index will give us the first clue that something is wrong, and as you can see in the chart below, bond volatility is not signaling “fire.”

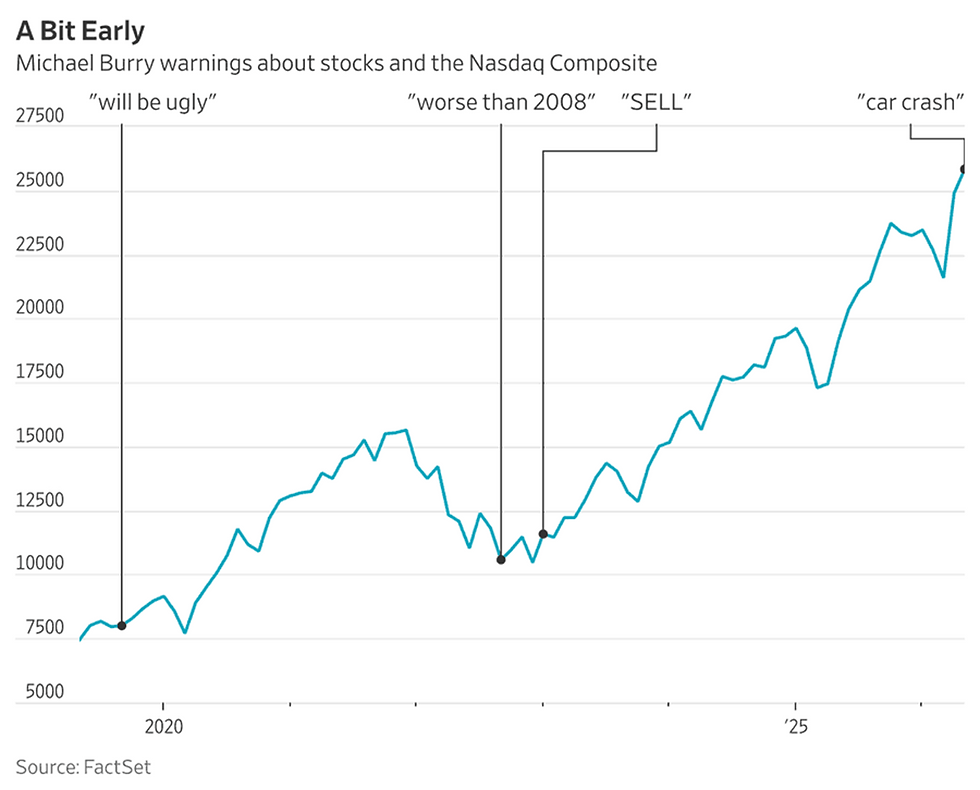
2.) BURRY – If you haven’t already, take some time this weekend to watch “The Big Short.” It does a great job of depicting what was happening in the economy leading up to the Great Financial Crisis (GFC). The movie chronicles Michael Burry (an MD by training turned hedge fund manager) and his actions during the GFC, turning one of the greatest fund profits in history. Dr. Burry is played by Christian Bale, who does a fantastic job. Why am I bringing this up? Because ever since then, investors want to follow his every move, waiting for that next historic trade to develop. The problem is that his results since the GFC have not been very historic. In fact, there’s a record of him warning of the next great fall...but either being very early or very late. As you can see below, his timing has not been great. I’m not saying this to disparage Dr. Burry. He’s wicked smart, and you can’t deny his GFC return of over +400%. That was historic. But the more important point is that over the last 5-10 years, markets have had a significant shift in how they function. There’s a mountain of systematic positioning, controlled by computer algorithms. Is that to say there won’t be another financial crisis or market bust? No… of course, that can happen at any time, and systematic portfolio structuring attempts to mute the next market drawdown. It simply speaks to the need to have ways to read how systematics and Volatility Control funds are functioning/positioning.
3.) VIX – Today is another huge Option Expiration (OPEX). It’s another multi-TRILLION dollar OPEX day for SPY (S&P 500 proxy) – where the crowd resets their “hedges.” That has tended to create volatility early in the day, only for it to wash out by the end of the day or early the next trading day. Right now, VIX is trading at about 19 with the futures curve in a “normal” mode with the front month future higher than spot and the 2nd month future higher than the 1st. In other words, even if the stock market is down today, the VIX curve is not signaling anything irrational… just the market taking a breather.


