So, Is This "The" Top?
- Chris Kline

- Jun 10
- 2 min read
1.) OIL – Some time ago, I commented on how Oil had spiked in 2008 and 2022 and then summarily collapsed, which led to deflationary conditions. Markets don’t like deflation…at all. My expectation at the time, and still now, is that this spike here in 2026 and subsequent fall would not lead to an all-out deflationary scare. So will that develop? That’s hard to say, but what I do know is that Oil is now down 23% from its Inflation Cycle Peak in April. So is Oil “crashing” similar to what we saw in 2008 and 2022? No…not yet anyway. Are there signals that would suggest that Oil will “crash” like 2008 and 2022? No. Oil right now, on a longer-term basis, looks more like late 2022 to early 2023 than it did two months after the 2022 peak in July. Oil volatility, in fact, looks like a bottom is forming. Opposite of what you tend to see in equity markets, oil volatility (OVX) tends to move in the same way oil does. If that correlation continues, and oil vol moves up, we should see Oil rebound some as well. That would actually help with the deflationary “scare.” Bond volatility also doesn’t look like it did then. It looks better, more muted. Could bond volatility spike toward 95 (it’s at 77 now)? Yes. But that would also be another lower high. Markets would not like a MOVE Index at 95, but it would likely be short-lived too. At least that’s what signals suggest so far.
2.) TOP – During the Internet/Telecom Capital Expenditure (capex) cycle in the 90s, three ingredients were visible by 1999-2000: 1.) Renewed Fed-hiking cycle; 2.) Credit spreads were rising 6-9 months before the 2000 market peak; and 3.) Growth was broadly visible with cyclical data like ISM firmly in expansion with a reading of 60. So far, the ingredients for a big top are still missing.

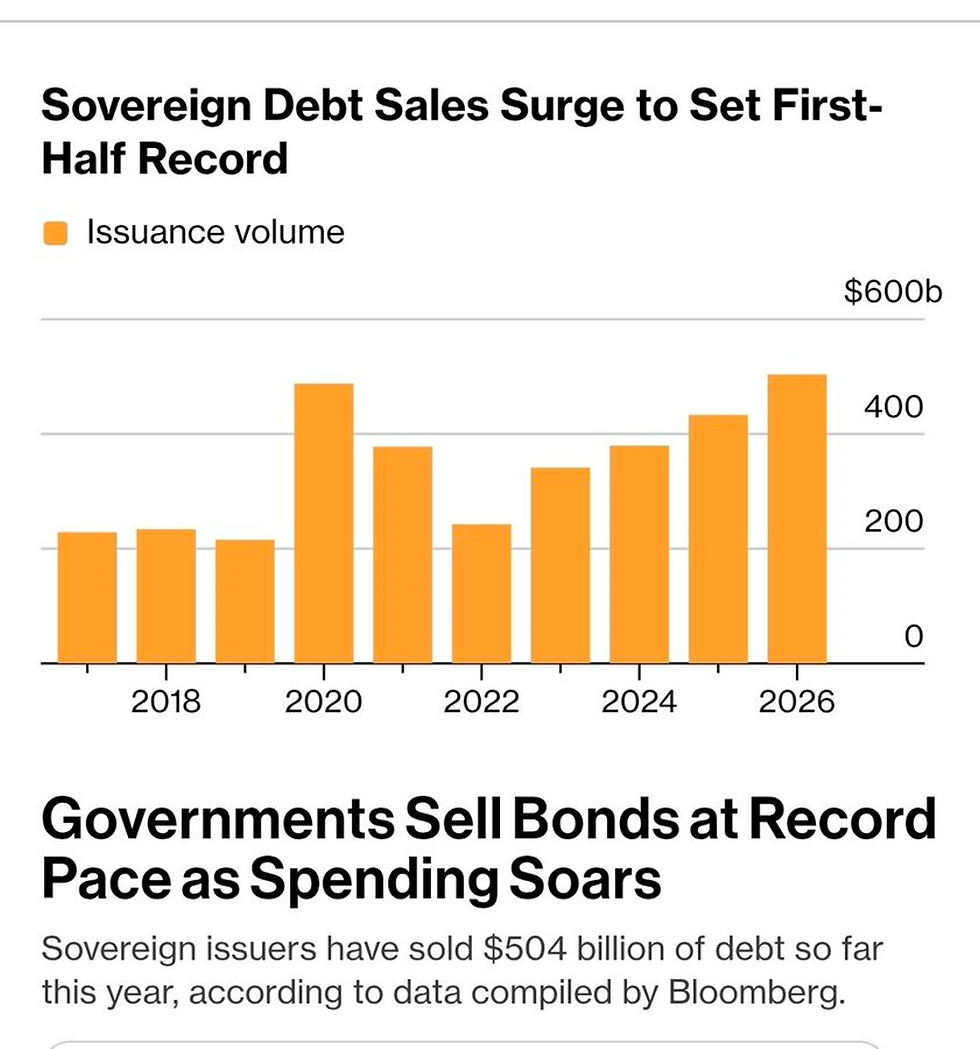
3.) BUBBLE – People are all seemingly focused on a “stock market bubble.” But the most dangerous bubble is what we see in sovereign debt issuance. Governments are drunk on spending power and need an endless supply of bond sales to fund it. That’s terribly irresponsible. But it is what it is. The risk, of course, is that at some point, bond buyers revolt and dry up. If governments can’t sell enough bonds to cover their irresponsible spending, they’ll just print more and more dollars (currencies) to cover it. Of course, that can be very inflationary… which central banks want far more than deflation… just look back at the 2020 monetary explosion the Fed threw into the economy. Will that happen again? Well, probably not exactly. Nothing in markets ever happens exactly like past instances. But there could be a rhyming environment. Either way, if the Fed prints to oblivion or the Treasury sells bonds to the sky, we know that excess supply not equaled by demand causes the price of that thing to eventually fall. If that relationship remains true, interest rates would likely rise and the Dollar would likely fall.