Does The Magazine Cover Strike Again?
- Chris Kline

- Mar 16
- 2 min read
1) ETF FLOWS – Last week marked the first week of net outflows from equity Exchange Traded Funds (ETFs) since April 2025. That tends to be the kind of behavior you see right around the time investors get shaken out before the next leg higher. Outflows from ETFs are pretty unusual, which is why when it happens it gets my attention. But when it happens, it often marks local lows. Does it guarantee the bottom is already in? Of course not. But historically, when sentiment reaches these kinds of extremes, it usually means we’re getting pretty close. I’ll cover some interesting developments in sentiment in #3.
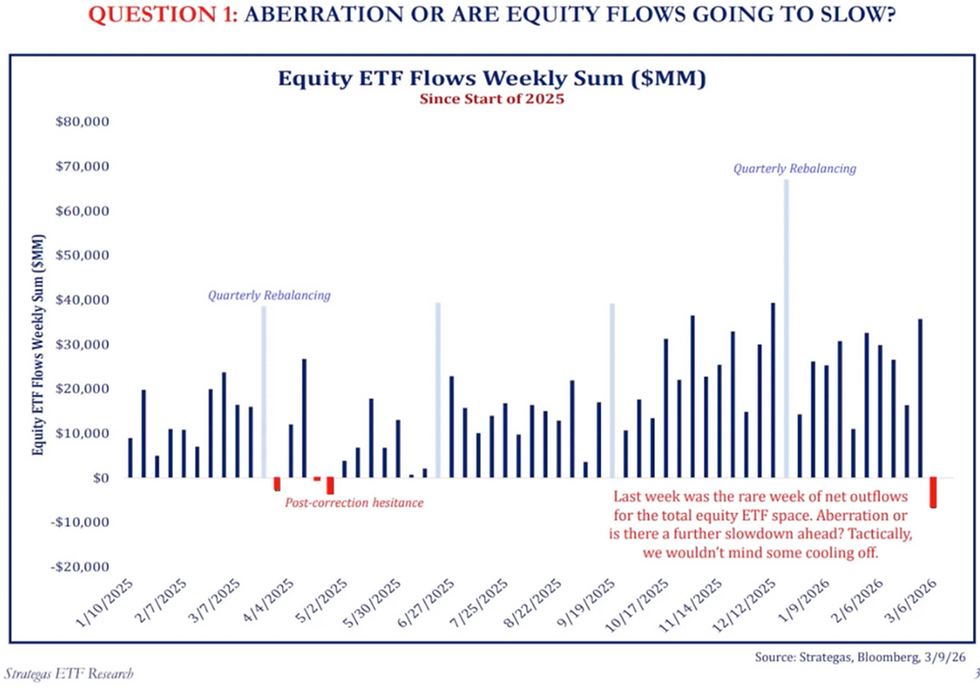
2) RESET – Are markets giving a reset, or signaling a real problem? As pointed out above, investors just pulled money out of U.S. equity funds for the first time since last April… which happened to come right before a really good rally. At the same time, the headlines are turning negative (see #3), and demand for portfolio protection has exploded, with put activity surging as investors rush to buy insurance. That’s usually how it works. By the time everyone decides they need protection, the damage has already been done. Healthy bull markets need tech. A major top in technology relative to the S&P 500 would be a big deal… and so far, that relationship (ratio) is holding (see below). But what’s interesting is what’s happening under the surface of that ratio. Software stocks essentially stopped going down last month. Meanwhile, semiconductors continue to outperform the broader market. So one of the most important groups (semiconductors) within technology is still acting like leaders.

3) SENTIMENT – Individual investors are now more bearish than bullish on equities over the next six months. And that’s been the case now for four consecutive weeks! Investors are uncomfortable. But we’re also seeing it from professionals. Earlier this month, we pointed out that active investment managers are carrying their lowest long exposure since last spring, which, of course, was right before the market ripped higher. And now the media is joining the party. The latest magazine cover of The Economist features a dramatic exploding chart, which is usually the kind of imagery that shows up right when investors are feeling the most uneasy (see below).

The old adage is that whenever there’s a chart on the cover, we want to buy stocks. History is full of examples where those kinds of covers showed up right around important lows. In all these cases below, they marked fantastic buying opportunities.

Now, if this time is different, we’ll see Consumer Staples break out relative to the S&P 500. That would mean investors are actively moving toward defense, and that usually brings more volatility and downside pressure for stocks. If the defensive sector is leading, that’s rarely a good sign for the rest of the market. But, for now, there’s no damage done.


