Shorts Tell Us The Market Is Well Hedged
- Chris Kline

- 6 hours ago
- 2 min read
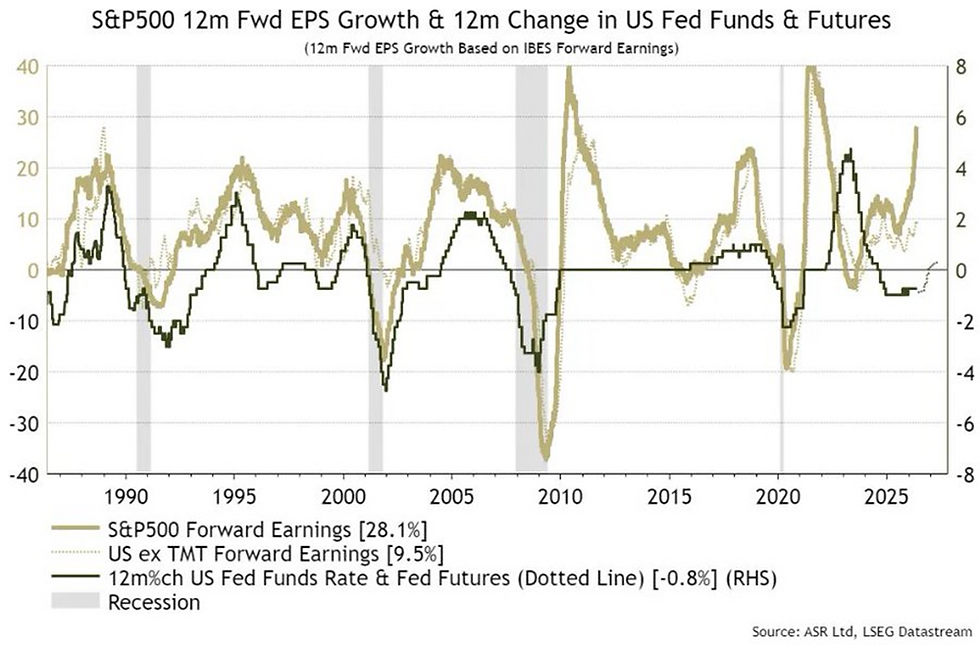
1.) RATES – There are more and more people becoming “concerned” with the bond market and rising rates. But let’s look at some facts. First, volatility is still under control as the MOVE Index put in a lower high on May 18 and is below trend again. Second, if you look at rates and earnings over a long history, you can see in the chart below that whenever earnings have risen like this, they have always brought interest rates up with them. The rate of change of revenues and earnings is where to see the truth. Q1 earnings data shows so far that 472 of S&P 500 companies have a YoY (year over year) growth acceleration of +27.5%, and of the NASDAQ 100, 90 companies have reported +46% YoY growth. So, maybe we shouldn’t be too worried about rates given the acceleration in earnings.
2.) SHORTS – I’ve discussed in the past how a healthy (large) short position in markets is good for the bulls. It places a hedge underneath the market. If that’s the case, then it seems markets are well hedged. According to Goldman’s Prime Book, hedge funds have increased their short exposure to the highest level in at least the last decade. Remember, buyers don’t have to sell, but shorts have to eventually buy. That is an important distinction when short positions rise like this. It can also lead to a violent upside rally if those funds have to cover those shorts quickly.

3.) P/E’s – More ink continues to be spilled about “high Price to Earnings ratios.” Sure, P/E’s are historically high, but we need to view them in context. What’s that context? What I pointed to in today’s first point…earnings growth. This year, valuations have actually compressed due to incredibly strong earnings growth. Don’t get hung up on the number; look at the rate of change of things. Since just the beginning of the year, the forward P/E (red line) for the S&P 500 is actually down about 5%. But forward earnings per share (teal line) are up.


