Growth And Inflation Accelerating Together
- Chris Kline

- May 1
- 2 min read
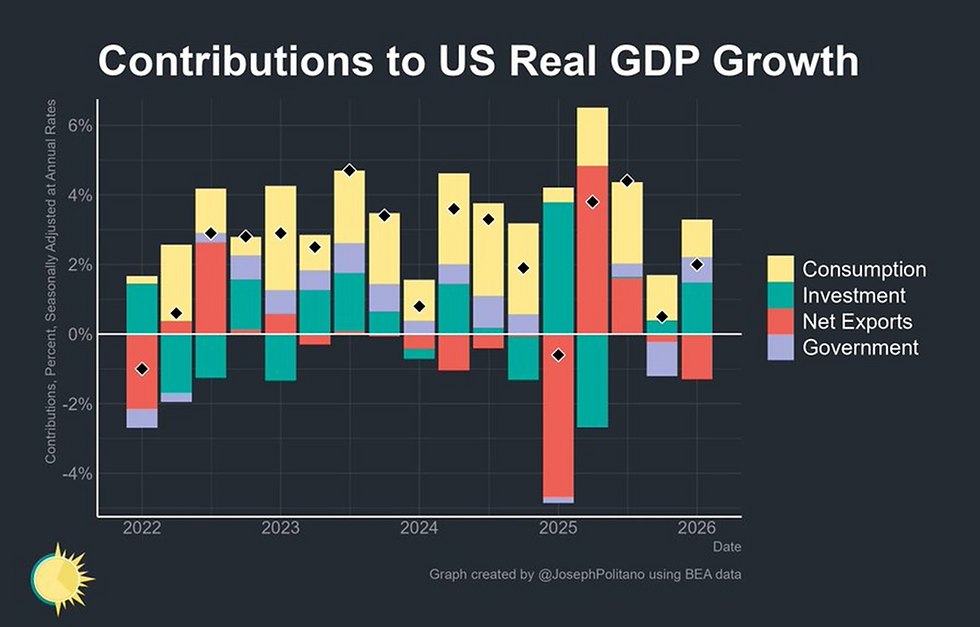
1.) GDP – Macro analysis should always take growth (GDP) and inflation (CPI) into consideration and determine whether we’re seeing a RoC (rate of change) acceleration or deceleration. In most cases, when both are accelerating together, we see risk assets perform just fine. Often, it’s that accelerating inflation that keeps investors afraid and skeptical, which are needed for healthy markets. Yesterday, US Real GDP came in at a 2% annualized growth rate in Q1 2026. That’s an acceleration from the previous quarter. Consumption and investment increased, government output rose, and the trade deficit increased. Nominal GDP growth (unadjusted for inflation) came in at 5.6% annualized.
2.) INFLATION – Yesterday, I commented on how the bond market was telling us to expect higher/accelerating inflation. What about commodities? For now, it seems like commodities, broadly speaking, are saying the same thing. Commodities continue to be one of our largest exposures in our Tiger and Grey Wolf models.

3.) OIL - But what about oil? On Wednesday, I asked if oil was going to top or what?! Here was my comment in case you missed it: “It (oil) could touch $111 and still put in a lower high that could usher in that top.” Yesterday, WTI tapped $113.43 before reversing and closing down -2.96% at $107.71. That was a lower high, and this morning WTI is trading down -2.4% to $105.18. So far, so good. The chart below shows monthly prices for WTI crude. The long blue line simply shows the extremes in upside prices in July 2008, June 2022, and now in 2026. Is it a coincidence that oil appears to be failing at that same trend line? Could oil now be ready for that top? From a longer-term perspective...probably. In the shorter term, with oil volatility still elevated, it's not likely going to be a quick drop. Some will look at this chart and say, "those drops came in the midst of bear markets for stocks!". That is true. But in both of those years growth was DEcelerating on a year over year basis, and inflation was decelerating on both a quarter over quarter and year over year basis. Risk assets don't like growth and inflation decelerating together. Those are differences from what we're seeing so far today.


