The Bond Market Is Speaking Clearly
- Chris Kline

- Apr 30
- 2 min read
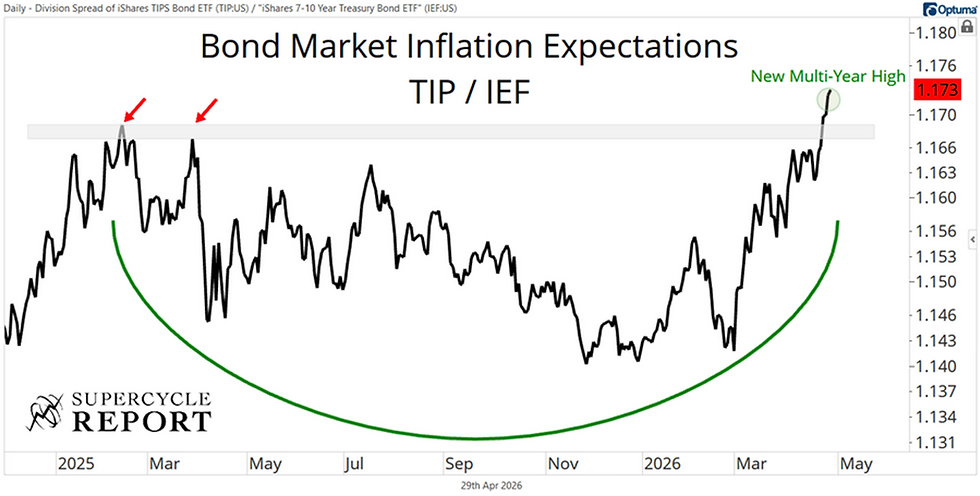
1.) RATES – When inflation is accelerating, the bond market will tell you so. Right now, the bond market is indicating that higher inflation is coming and that rates are likely to be higher for longer. Some might get freaked out by that, adding to the narrative that rising inflation and bond yields will crash the stock market. Not likely in the near term. Stocks can do just fine with inflation accelerating as long as we also have accelerating growth with it… and for the next couple of months, the bean counting says that is the likely outcome. But, given what rates are saying, this isn’t the spot to be overweight in bonds. The chart below is just a ratio of inflation protected Treasurys (TIP) to intermediate term Treasurys (IEF). TIPs are leading.
2.) BUBBLE – Everyone is always on the lookout for the next “bubble” and its pending doom. The doom-speak is, of course, loudest for those sectors that have moved the most. Understandable, but that’s not how this works. Despite the semiconductor and dot-com bubble headlines, we aren't seeing that many LPPL exhaustion signals in Information Technology yet. The LPPL exhaustion signal refers to a trend reversal or climax indicator derived from the Log-Periodic Power Law (LPPL) model in financial markets. Instead, Utilities are flashing the most aggressive bubble exhaustion signals at present. Wouldn’t that be just like Mr. Market… take a traditionally defensive sector like Utilities and suck in retail right as it gives exhaustion signals. Could they run higher? Of course! Markets can stay irrational far longer than most expect. So this isn’t a warning that Utilities are now on the edge of collapse… but it is nevertheless a warning signal. Could this time be different because of the AI data center energy needs? Maybe.

3.) FLOWS – Most of the time when I reference “the Flows,” it’s with respect to the major index flows. But every now and then, individual sector flows pop up on the screens and make you look closer. While flows to industrial and industrial-adjacent exposures are quite elevated here, price isn’t yet suggesting a break lower. Sentiment is pretty enthusiastic towards these areas, so it’s certainly something to keep in mind. When everyone else is excited and euphoric…I’m cautious.


