
Is The Consumer Really Dead?

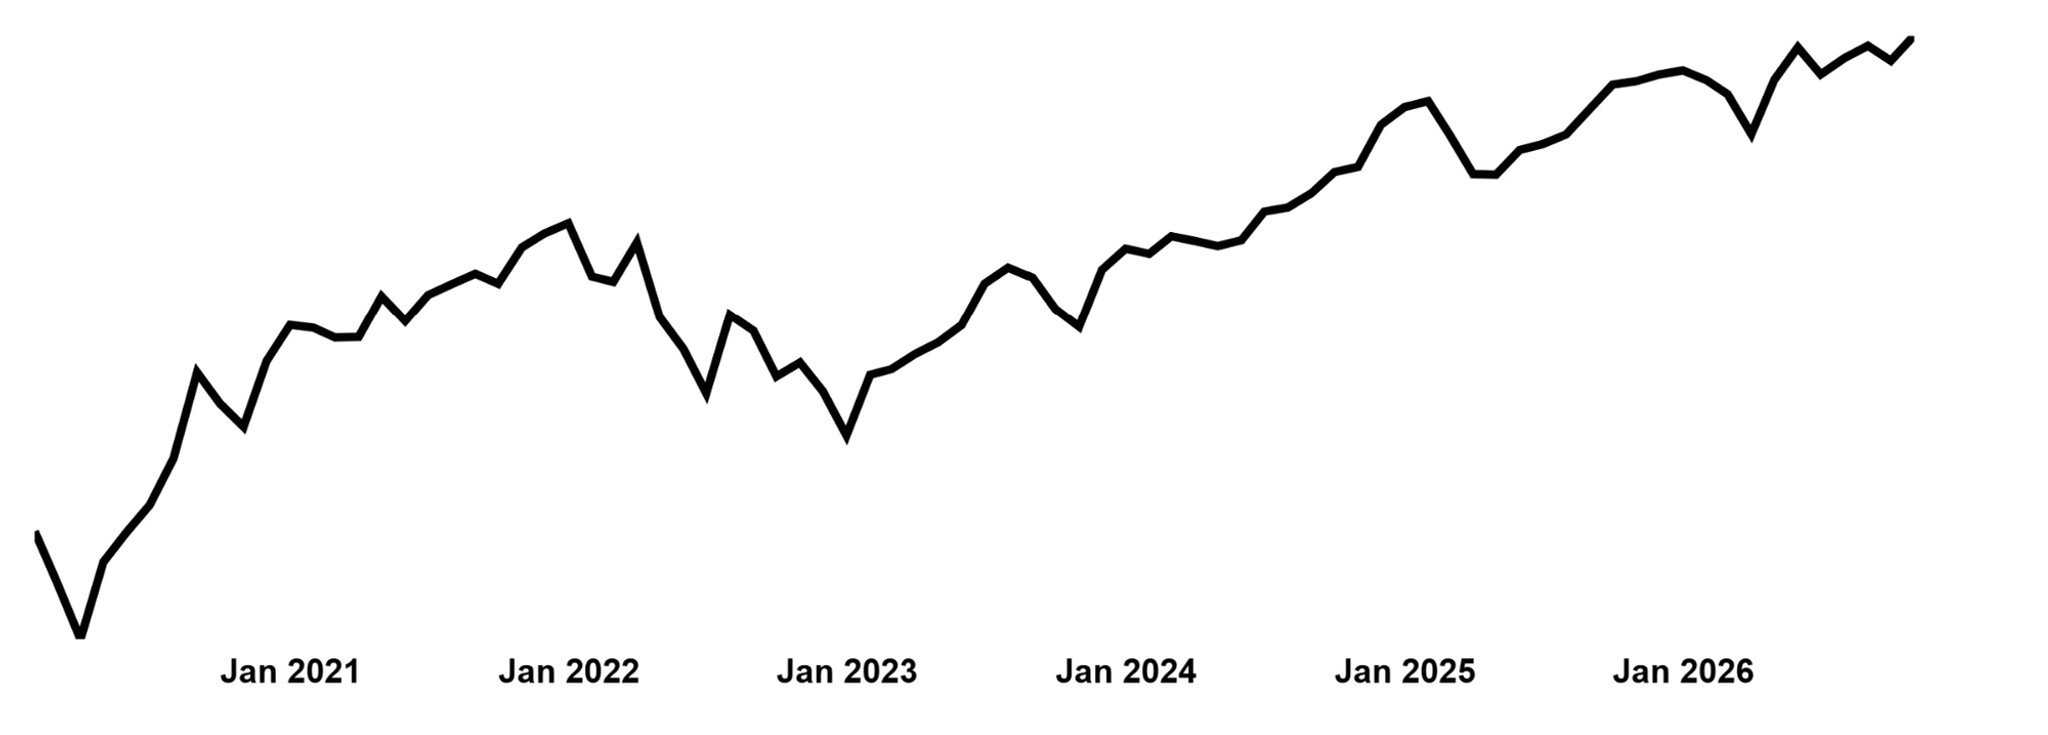
1.) CONSUMER - If you were to only pay attention to the "consumer confidence" data that comes out each month, you might think that the average consumer is dead broke and not spending. But you might think differently if you were to look at a basket of companies that reflect WHERE and how people are spending money. The consumer confidence data tells us that there are persistent worries about purchasing power, inflation, and affordability, keeping the consumer under pressure and lack of confidence. Considering how inflation has been, it's easy to feel that way. According to the University of Michigan Consumer Sentiment survey, Sentiment is ~10% below a year ago and ~15% below February levels. But what are the companies doing that benefit from real consumer spending? If you look at a real-life basket of companies that include Apple (AAPL), Walmart (WMT), Costco (COST), Target (TGT), Walt Disney (DIS), Visa (V), Mastercard (MA), American Express (AXP), United Airlines (UAL), Delta Air Lines (DAL), Uber Technologies (UBER), and Simon Property Group (SPG) you'd see that the consumer might be doing better than the data suggests. In this homemade index, bigger companies get bigger weights, just like in the official index. In this index, you've got tech, financials, industrials, communications and real estate. Pretty much like real life. Right now, that dashboard looks a lot healthier than the official consumer index does. This doesn’t mean every family is doing great. Clearly they are not. But when we include more of the businesses where families actually spend money, the picture gets a lot stronger.
2.) HIGH YIELD - High yield bonds can often tell a story about where equities might be headed as their values tend to be more closely linked to equities' earnings than yields. We can see how high yield is doing by looking at the Advance / Decline data for High Yield bond investments versus simple moving averages and the current S&P 500 index. What's it saying? That High yield still stinks - down about -4% this year. That's unfortunate for stock market "buy and hold" bulls since those two items - High Yield A/D and the stock Index - tend to move in the same direction with High Yield leading. If that relationship remains true, yesterday might not have been the bottom for US equity markets...especially for tech. Words of the day for investors? Be nimble and have a process.

3.) TREND STRENGTH - Within the S&P indexes (small cap, mid-cap, large cap), the percentage of stocks with 50-day averages above their 200-day averages has begun to recede fairly meaningfully. This is reversing the gains seen earlier this year, and that is pointing to some underlying weaknesses. The mid-cap indexes are signaling the weaker of the three cap weightings. Does this mean markets are going to crash? No, but underlying weakness in individual constituents versus the index isn't ideal either. Interestingly, "safe" stocks have become expensive while growth and momentum names have become relatively cheap. Additionally, the S&P 500 12 month forward price to earnings (P/E) ratio is at levels not seen for several years. This might point more toward rotation within the index than anything else. Rotation away from tech still seems relevant, while at the same time we're seeing rotation toward more value names and staples and healthcare. The "Value" style factor is stronger than the "Growth" style factor. Just compare IWD (Value) vs IWF (Growth) - bottom chart. If that line is moving up, Value is beating Growth. It's also important to note that there are some big names that take up space in both of those style factors...Apple, Amazon, MicroSoft are a few. Again, this just points more toward internal market rotation than anything...Nvidia (and semiconductors) and Google are lagging, while the other three have picked up.


