
Let's Play Fed Hike Game Theory

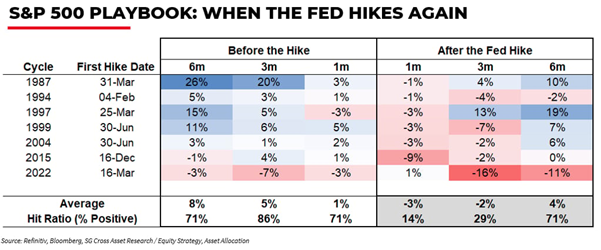
1.) HIKE – Given the circumstances under the surface of everyone yelling about rates, I still don’t believe the evidence points to a rate hike this month. The labor market is fairly weak, and the Fed is actually getting what it wanted…higher rates! I’ve said it before, but I’ll say it again: the cure for higher rates is higher rates. Nevertheless, let’s play the rate hike game and consider what history has to say about it. What do we know this time around? There is no yield curve inversion…meaning that short-term rates (2YR Yield) are NOT higher than long-term rates (i.e., US 10YR Yield). Does the stock market like rate hikes? No, not really. But does it spell doom if the Fed does hike? No…not unless the yield curve is inverted. And it is not. If there is no curve inversion, investors tend to buy the mid-cycle hike. Sure, history says that the S&P 500 hates the hikes for about 1-3 months. But, the market also tends to make new highs in 6 months. The exception is when the yield curve is inverted…and we’re not seeing many scenarios where that happens.
2.) A/D – What does market participation look like today? Well, to know that, we look to the Advance/Decline lines. Right now, cumulative advance-decline lines are all below their 50-day moving averages. Is that a big deal? Not really. Does that spell doom and the end of the world? No…not yet anyway. However, weakening of these lines does point to some weakening in market breadth or participation. But we have to think about current conditions and positioning to make sense of this in real time. Considering the amount of deleveraging by hedge funds and the increase in short selling that has taken place – pointed out yesterday (see that post here), we shouldn’t be too surprised by a weakening of breadth. But, as I pointed out yesterday, if positioning has come down that much, we have to think about who is really left to sell? We’ll watch these breadth conditions, but financial media is probably making it out to be more than it really is. Participation conditions are important, but until price actually tells us something, we’ll just patiently watch what’s happening under the surface.

3.) INFLATION – One thing that seems to get missed in the “inflation is too high” conversation is that growth tends to come with inflation. Treasury Secretary Bessent says, “The world is awash in debt… the only way out is to grow our way out.” Ok… that likely requires inflation to accelerate some as well. Fed Chair Warsh says, “Inflation is still above 2%... not broadly restrictive… a hike is on the table.” One wants lower rates and a growth sprint. The other just retired forward guidance and told markets to stop looking to the Fed for their next trade. However, while the “official” CPI is at 3.4%, real-time inflation (via Truflation) is at 2.12%. That’s a big gap. So here we are with a weak labor market, real-time inflation near 2%, and high market rates doing their job… in my mind, all this continues to point toward a no-hike scenario more than anything.


