
What's Needed To Revive The Bull?

1.) BULL NEEDS - What things need to occur to keep a bull market alive? The way I see it, there are three. Now, to be fair, all three major indexes - Nasdaq, Dow Industrials, S&P 500 - are in a technical bearish trend when defined as trading below their rates of change of price, volume and volatility. We don't use arbitrary numbers (like -20% down) for that bearish definition. But here's what we need for the bull to be revived.
Credit Spreads need to narrow. Interestingly, and importantly, while stocks made lower lows, credit spreads HAVE narrowed. That's good. The riskiest junk bonds in America got calmer while the Nasdaq was falling. Right now I'm seeing higher lows in credit spreads and lower lows in the Nasdaq. That’s a classic divergence you tend to see at bottoms, not at the start of a new crash. So these spreads have to hold to revive the bull.
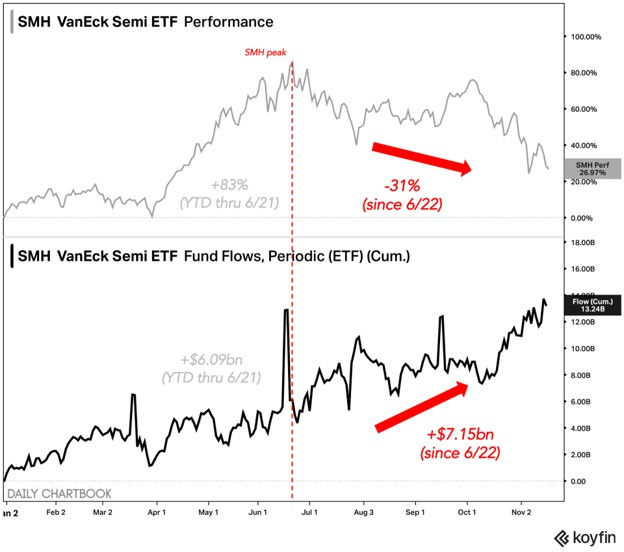
Semiconductors need to repair. If the market is going to keep going higher, the chip stocks have to be a leader, not the problem. Realistically, the semi tracker fund - SMH - needs to get back above $527 at the low end. If we're still in a bull phase, that level need to be reclaimed and held. If instead semis roll over from here and start making new lows, while credit spreads widen pat that Nov 5 low, the message is simple: Bull market canceled. Nvidia had a really good earnings report last night, but that stock has a lot of work to do to get back into bullish trend. It needs to reclaim and hold $191 on the low end.
US Dollar needs to fall. A strong dollar is a headwind for stocks. A failed dollar breakout could be a massive tailwind. Now the U.S. Dollar Index has pushed above its October highs. This breakout needs to fail pretty quickly here if the bull is to be revived. My first big level is 102. If the dollar index (DXY) falls back below 102, the whole move above the October highs can become a failed breakout. If instead the dollar keeps pushing higher from here, while semis make new lows and credit spreads blow out past their Nov 5 low, this bull market is done for a while.
That's the checklist - credit spreads hold their lows, Semis trade into that $527 range and the DXY gets back below $102. We don't need to guess...just need to watch the prices. But until then, we have a technical bear trend that likely causes markets to trade sideways to downward. Remember too...there are A LOT of shorts in the system right now. If those shorts are forced to cover, we could see a violent rally, that of course could fail at respective trends, but a short term rally nonetheless.


2.) SEMIS - How probable is it to see semiconductors recover? That's a great question, especially since it is one of the three legs of the bull market stool. Well, if market flows have anything to say about it, that recovery is definitely possible. More than half of SMH's YTD inflows have come since price peaked on June 22. A "prices down, flows up" divergence doesn't tend to last. Prices usually catch up to the flows.
3.) 200 - The S&P 500 closed below its 200 day moving average for the first time since April. Does that matter? It can. The S&P 500 needs to get back above 7495 at the low end to trade out of this bearish trend condition. A failure there would just confirm more of a bearish / downward trend. But that also doesn't necessarily mean everything is going to get plowed either. Here's a look at the instances of returns when the S&P 500 first closed below its 200 day moving average after 126 or more straight sessions above that level.


