
Investors Are Running Out Of Cash...Should We Panic?

1.) CASH – The chart making its rounds now, which is supposed to make everyone worried, is the Bank of America Global Fund Manager Survey. It seems that fund managers are now holding just 3.5% of their assets in cash. That’s the sixth-lowest cash level since 1998, and apparently, investors are supposed to be worried about that. I’m not. Why? Well, first of all, why would fund managers have less cash? Because they spent it. And what did they spend it on? Stocks. And where are stocks? Near their highs. So yes, investors have been buying stocks during a bull market. Shocking, right? The argument goes something like this: If investors are holding very little cash, they must already be heavily invested. And if everybody’s already invested, who’s left to buy? That sounds reasonable, but the problem is that history tells a different story. Look back at other periods when cash levels were very low, and you’ll find plenty of times when stocks just kept going. Cash levels were low around 2004, and stocks continued higher. They were low again around 2006, and stocks kept rising. They were also low in 2013, which turned out to be an incredible time to own stocks. Were there bad periods when cash levels were low too? Of course. That’s the point. Low cash levels have occurred before both good and bad periods for stocks. By themselves, they don’t tell us very much about what comes next. High cash levels are much more interesting to me. Look at what happens when fund managers are holding a lot of cash. We saw it in March 2003, December 2008, June 2012, October 2016, April 2020, and October 2022. Those were periods when investors were scared and selling, and many of those periods turned out to be fantastic times to buy. The point here is to pay attention to extreme pessimism more than extreme optimism. High cash levels tell me investors are afraid… time to be a contrarian. Low cash levels tell me investors have been buying stocks. Some will see these low cash levels as a “sell” signal. I don’t. It’s just evidence of what’s already been happening during this bull market.

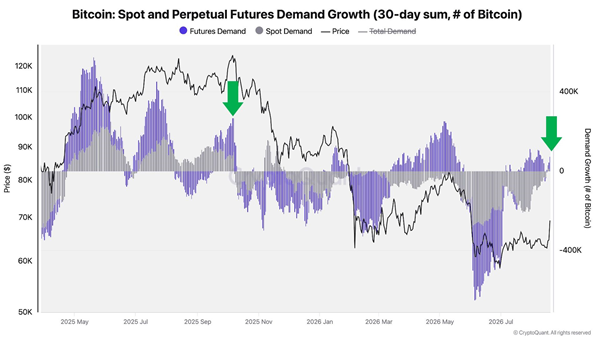
2.) BITCOIN – Earlier this week, I commented on large speculator positioning in Bitcoin futures, often referred to as “perpetuals,” and noted that their large buying has often signaled longer-term low points for Bitcoin. That was when Bitcoin was trading at about $65,000 per Bitcoin. Right now Bitcoin is trading around $77,000. The demand for Bitcoin has really taken a jump higher over the last couple of days. For the first time since the October 2025 all-time high, Bitcoin demand has turned positive in both spot and perpetual futures. The scale remains pretty modest, but if this holds for another month, it would be reasonable to conclude that the bear market is over and a new bull cycle has begun. That lines up with the “time capitulation” that I alluded to with respect to Bitcoin’s amazingly repetitive 4-year cycle. I doubt that Bitcoin just goes straight up from here. A re-test of the top of the trend at about $70,000 would not be surprising. If that holds, buying Bitcoin would become less risky. Will we still see volatility? Of course! It’s Bitcoin. Remember, too, there’s currently a strong inverse correlation to the US Dollar, and the Dollar is oversold here.
3.) MANUFACTURING – So, what do on-the-ground business conditions look like? Pretty darn good. The August Philly Fed reading for business conditions six months from now saw its biggest monthly jump ever, hitting its highest level since August 1983. This survey has been running monthly since 1968, making it the longest-running regional Fed survey. Ignore the noise that the world is ending.


