
US Debt Isn't The Problem Mainstream Wants You To Believe

1.) DEBT – The mainstream narrative says the world is fleeing U.S. debt. But the data say something entirely different. 30-year yields have risen across every major developed sovereign issuer, and the U.S. is not even close to the worst performer. Japan, Germany, France, the UK, and Italy have all seen long-end borrowing costs soar far more than the US. This is not a uniquely American “loss of confidence” story. This is a repricing of sovereign risk after years of debt expansion, a monetary tsunami, and rising refinancing needs. OECD sovereign borrowing is projected to reach about $18 trillion in 2026, with refinancing alone near $14 trillion. There is no global flight from U.S. debt. There is a global repricing of sovereign solvency risk. U.S. rates across the curve continue to signal a bullish (upward bias) trend…but so does growth. So, an environment where we see growth and inflation accelerating is a macro environment where risk assets can do just fine.

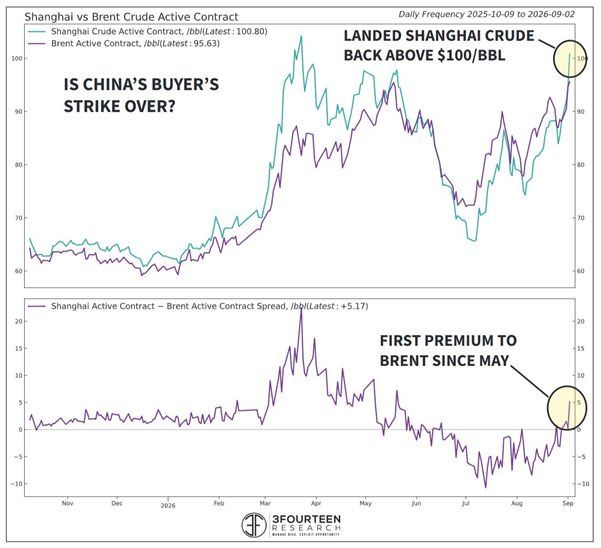
2.) OIL – Is Oil ready to move even higher? Maybe. WTI broke above trend at about $87 and has since moved up toward $93. It’s defiantly bullish trend now, but signals also suggest that it might be ready for a little breather. That doesn't mean a collapse in price has to happen. It could result in sideways action. Same is true for Brent crude…it broke out before WTI, but it also is signaling some short term “exhaustion”. Could China be in the mix here? Also maybe. Shanghai crude futures are now above Brent Crude for the first time since May. China has been on a bit of a buyer strike and has been one of the most important reasons oil prices have remained subdued during the Iran War. But now it seems China is buying again, and they have a lot of buying power.
3.) WEEKS – So many people love investment charts. Makes sense. They give you a sense of what history has looked like for an investment and also where buyers and sellers have had battles. There are lots of different ways to look at charts…daily, weekly, monthly…and for the degenerate traders in the world…by the second or minute. So much for “long term,” hey?! Zooming out on an investment setup has a lot of value. Right now, everyone still seems fixated on the “mid-year -10% correction.” I’m not saying it can’t happen, just what I’ve written before in that if everyone is saying something and likely acting on it, it isn’t likely to happen the way the masses expect. So, let’s zoom out on a few sectors to get a glimpse of the health of this current market. First, the 800 lb gorilla…Nvidia (NVDA). A few years ago, Nvidia started making new highs before a lot of the rest of technology really got going. It was one of the leaders in 2023, and eventually, the rest of the group joined the party. Is it doing it again? I don’t know…maybe. But it's hit a new high and large-cap tech is right behind it again. Energy and financials are looking good too. These are very different parts of the market telling us similar things. The weekly looks get rid of the daily noise. Right now, there is a lot of daily noise (worrying investors) that isn’t amounting to much.


