Will "Buy In October And Get Your Portfolio Sober" Hold True?

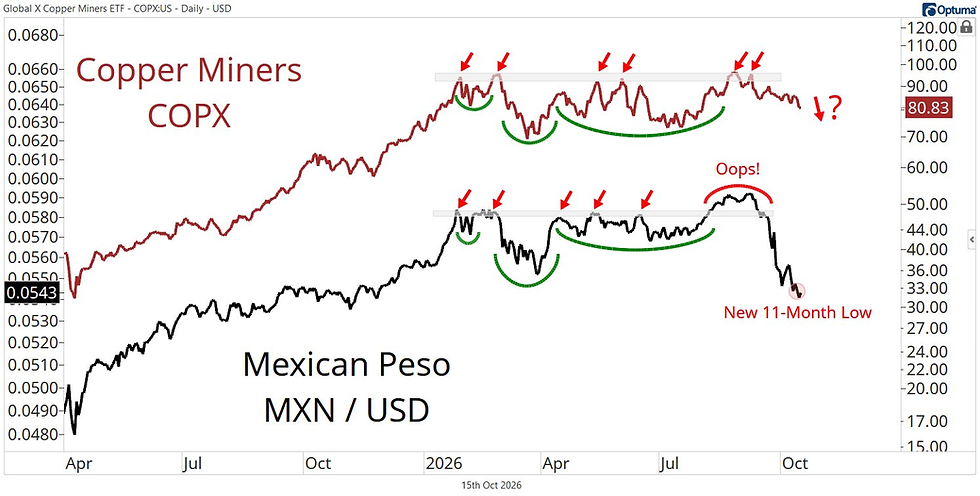
1.) METALS - We’re constantly hearing about the extraordinary demand for copper, lithium, nickel, rare earths, and everything else needed to power artificial intelligence, electrification, and the modern economy. But over the past several months, I’ve watched one metals group after another fall apart, even as investors continue celebrating their long-term prospects. Precious metals have struggled. Lithium and nickel have come under pressure. Rare earth stocks have been absolutely demolished. And now I’m wondering whether copper is next. Rare earth stocks put in a pretty textbook climax top last October. The Rare Earth tracker fund, REMX, is down -27.7% so far this year, -23.6% in the last 3 months and -21.4% in just the last month alone! Yes, these materials are important and in need, but that hasn’t stopped investors from abandoning the stocks. Copper has been one of the few metals holding up remarkably well, supported by legitimate demand from electrification, AI, and infrastructure investment. But there is a relationship that is revealing some concern. Copper miners and the Mexican Peso have historically moved together, reflecting their shared sensitivity to global economic conditions, industrial demand, and investor risk appetite. Throughout 2026, both carved out constructive accumulation patterns within strong primary uptrends, and until recently, they appeared ready to break out together. Then something changed. As you can see in the chart, The Mexican Peso briefly broke out to new highs, failed miserably, and has since collapsed to its lowest level in roughly 11 months. Meanwhile, copper miners are still hanging around the upper end of their trading range, seemingly oblivious to the weakness in their longtime companion. But this is a divergence that has my attention.
2.) COPPER - Well, since we discussed copper miners, we may as well look at copper itself. Copper has the distinction of having a PhD in economics..."Dr. Copper". If copper starts materially slowing, that'll be important as it would reflect the increasing potential of a bout of growth slowing. What indications are there to consider if Copper is about to roll over? Futures positioning. We want to know where traders are placing their bets, how crowded those trades have become, and whether price is confirming their expectations. Historically, speculative positioning has moved closely with copper prices. When speculators become aggressively bullish, prices tend to be near important highs, while extreme pessimism often accompanies major lows. Right now, speculators are coming off the largest net long position in history. That begs the question, who's left to buy? In my opinion, maybe not many. The primary uptrend is intact, but this heavy long positioning could be an indication that Copper is about to roll over. What helps us see that is the latest Commitment of Traders (COT) data from the Commodity Futures Trading Commission (CFTC). It shows large speculators reducing their net long exposure by nearly 17,000 contracts in a single week. That’s a lot and that's important because when a crowded trade starts moving against its participants, the selling can feed on itself. I’m not suggesting copper is guaranteed to collapse. But we have to look at the facts. As noted in #1 above, rare earths are getting whacked, Mexican Peso has broke down, Copper miners are struggling to keep up and Copper futures positioning is coming off historic highs. That's a fair amount of warning signals about a copper market that everyone seems convinced can only go up. What's the old saying? Oh ya...Beware of the heard at extremes.

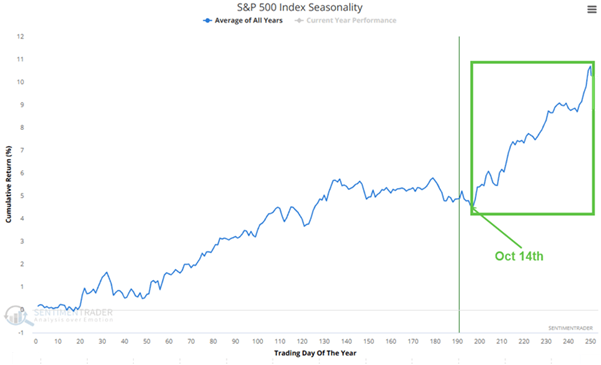
3.) OCTOBER - There are some funny sayings in market lore. Everyone has heard, "Sell in May and go away", which of course doesn't always work. Then there is “Buy in October and get your portfolio sober.” That's even funnier, and also not always accurate. But, each of these sayings do have good historical averages too. And since they've got a long history, they are at least worth exploring. One of the seasonal patterns that we're in the midst of right now are the mid-term elections. Historically speaking, we're entering the best six months of the year - November through April. But, we're also entering what has historically been the strongest stretch of the entire four-year presidential election cycle. For whatever reason, stocks have developed a pretty interesting pattern around this four-year election calendar. Historically, the second and third quarters of the midterm year have been especially difficult. And so far, Q3 for markets haven't been amazing. But now we're entering that historical "sweet spot" for equities. Below is a picture from the Stock Traders Almanac that chronicles this phenomenon. Here's what's interesting. Stocks are "supposed" to struggle badly in Q2 and 3 of the midterm year. But overall, they really didn't. Both the Nasdaq and the S&P 500 are higher since March 31, or the end of Q1. So, if they didn't really go down during the historically difficult part of the midterm year, how will they do in the strong part? No one knows the answer to that question. But notwithstanding the potential warnings from Copper, this seasonal pattern suggests this is not the time to abandon the market. Not yet anyway.